
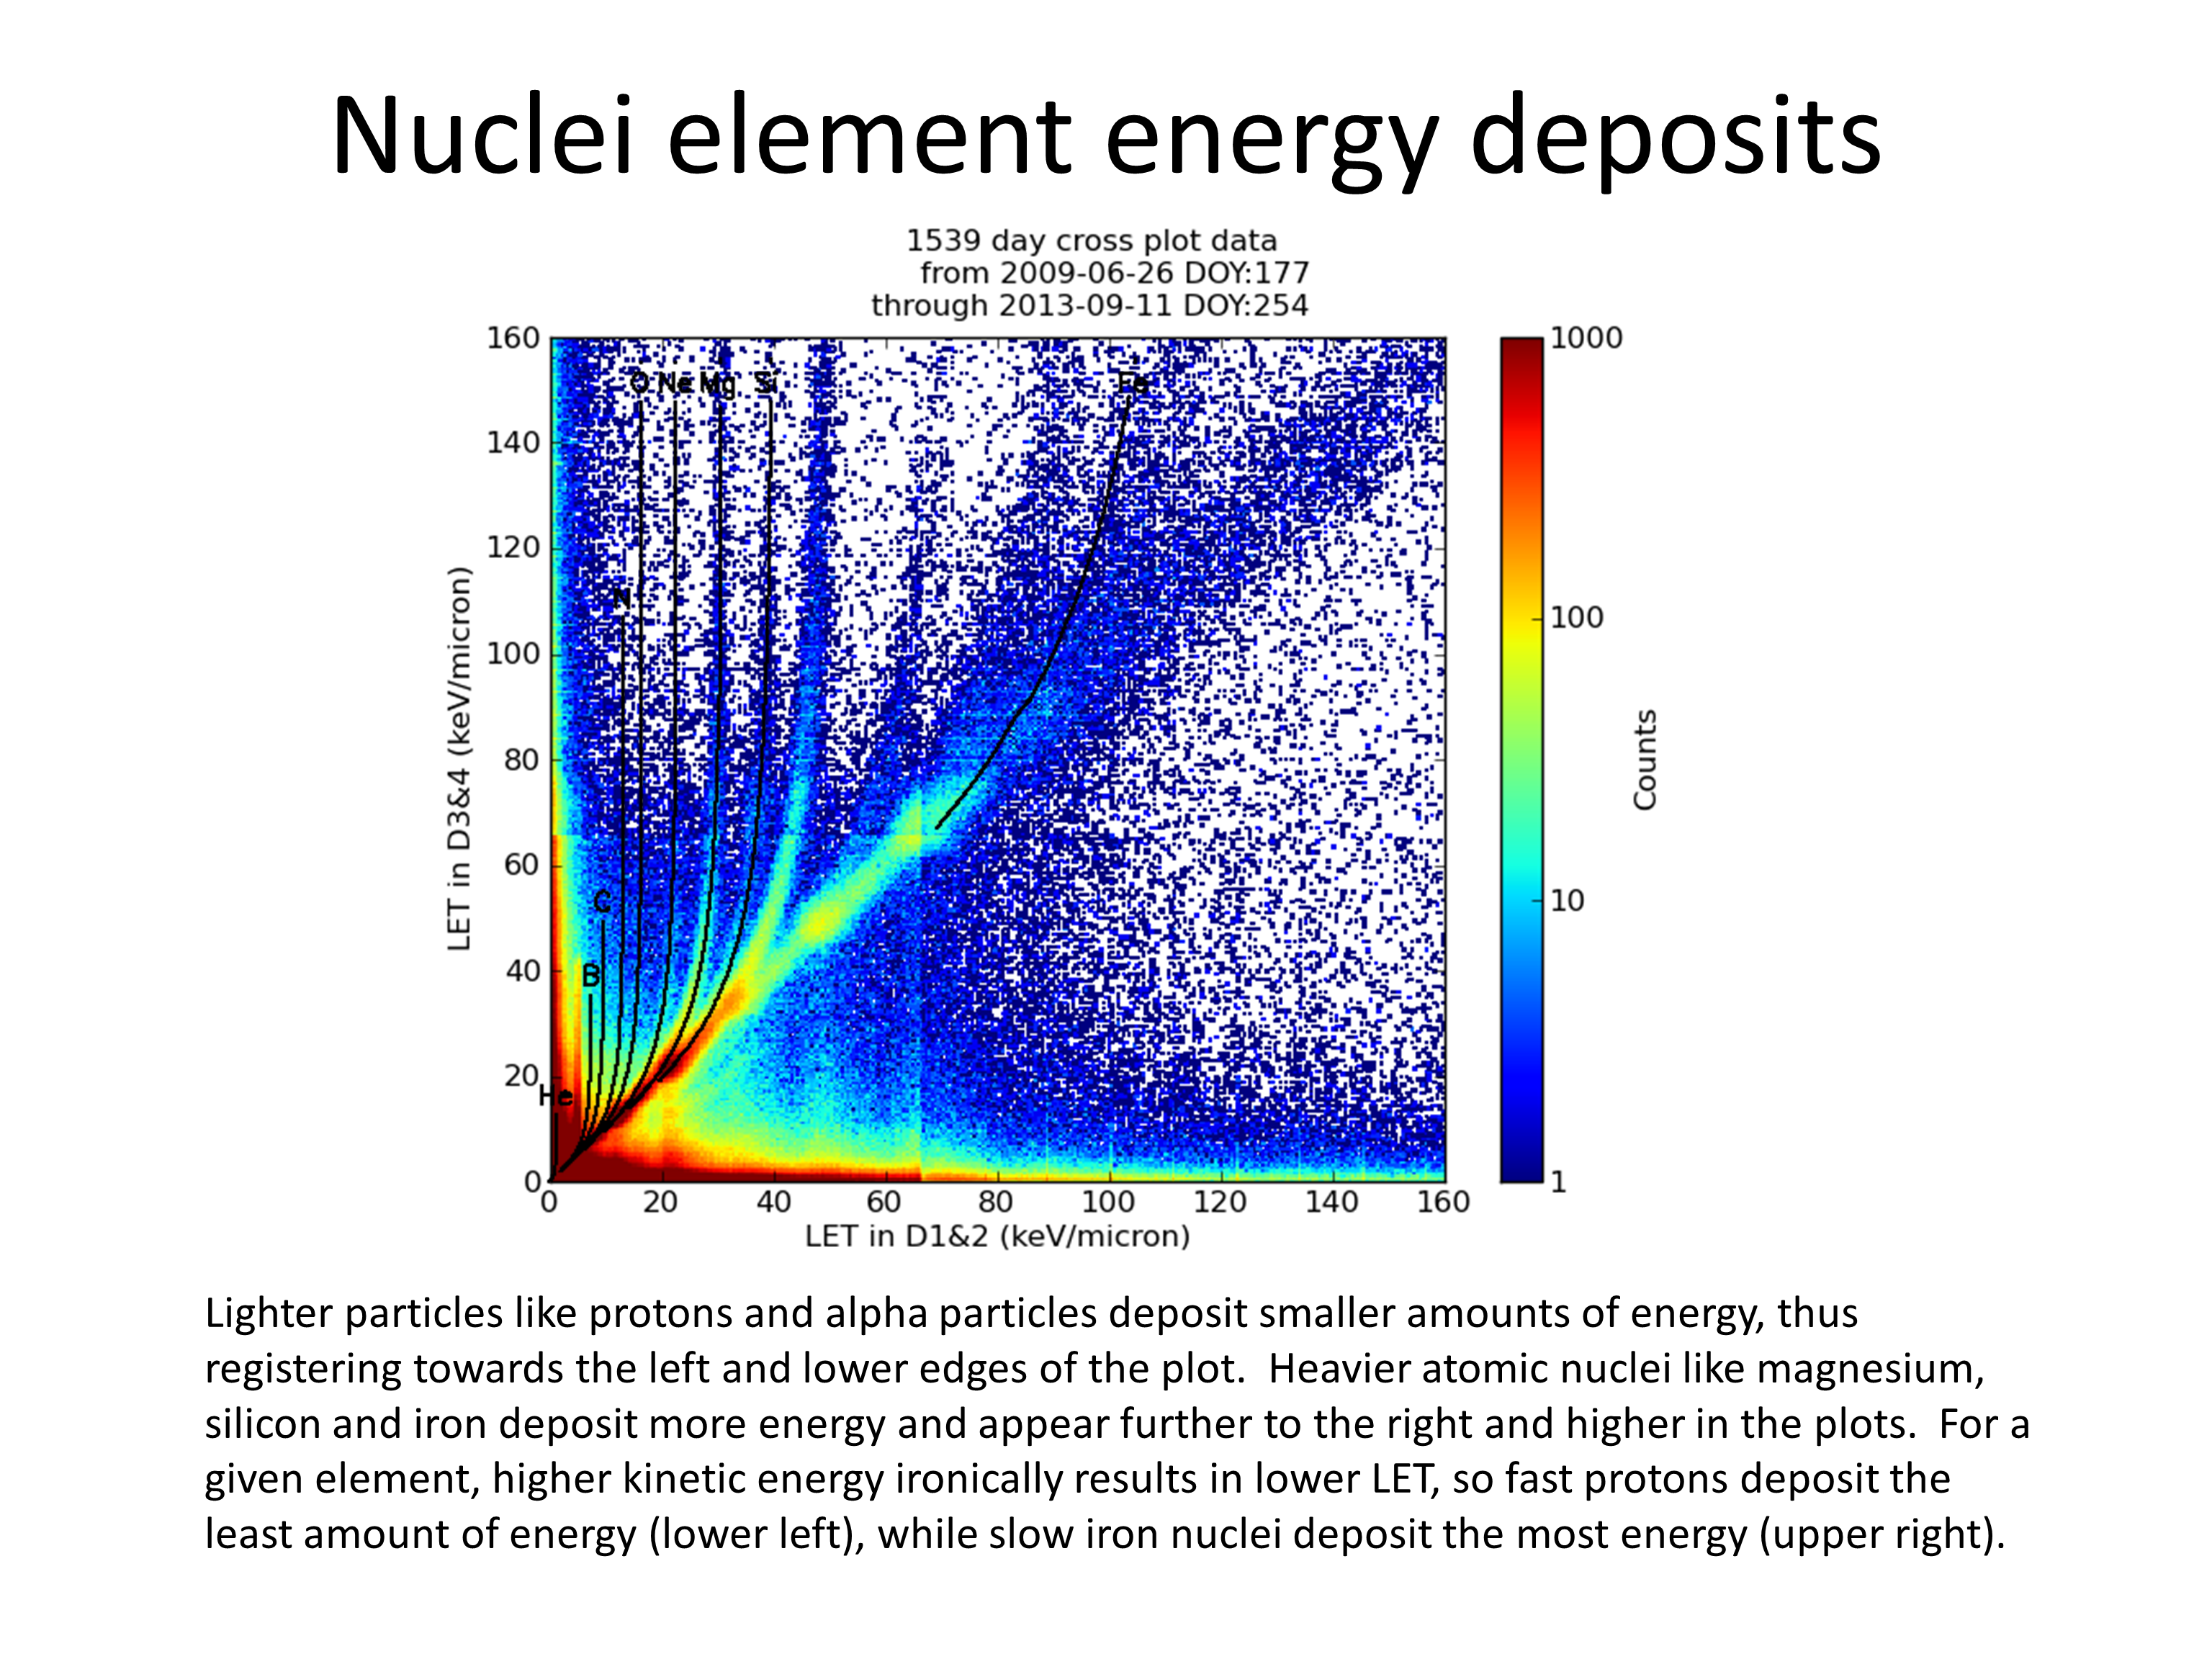
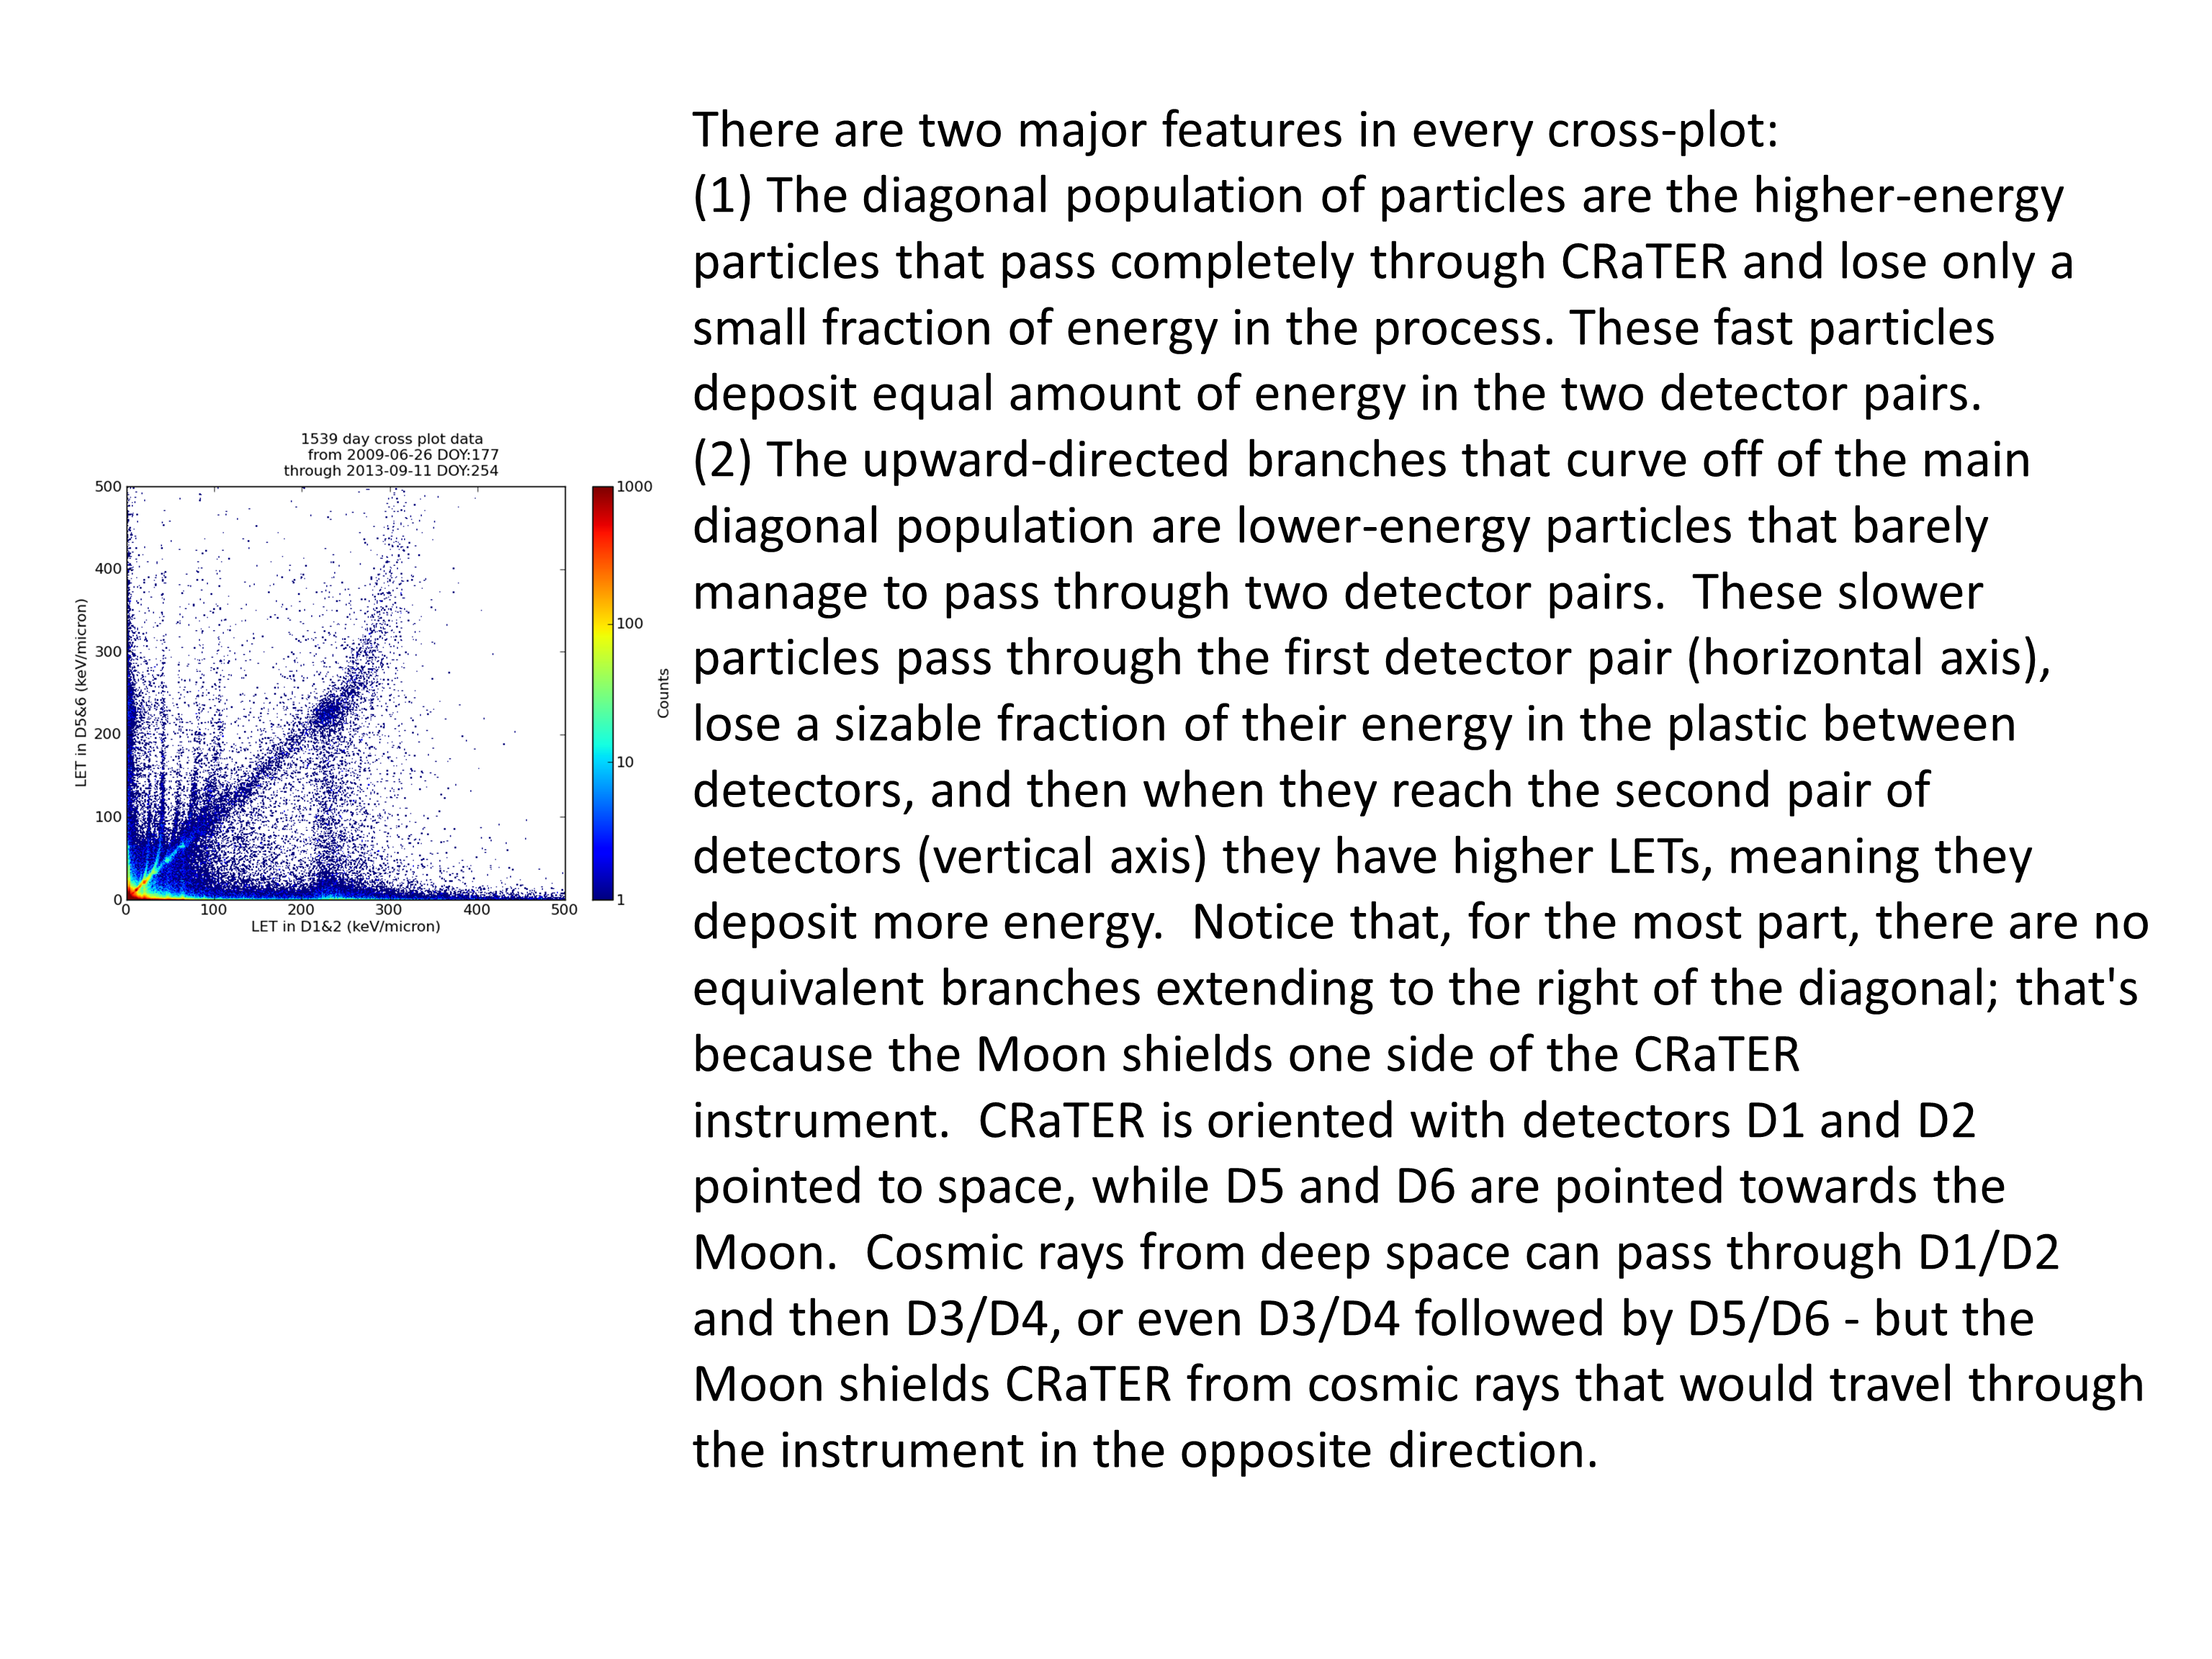
The peaks in the LET plots correspond to "minimum-ionizing" nuclei of different elements. Minimum ionizing nuclei are those with approximately 1 GeV of kinetic energy per nucleon, so minimum-ionizing protons have ~1 GeV of energy, minimum-ionizing alpha particles have ~4 GeV, etc. At these energies, nuclei are traveling fast enough to minimize the interaction times with target nuclei in the detector, but they don't have so much kinetic energy that their masses substantially increase due to relativistic effects; thus they deposit the least amount of energy possible, on average, while passing through matter. Nuclei with higher *or* lower kinetic energies both register at higher LETs to the right of their corresponding minimum ionizing peaks; lower-energy nuclei are far more numerous, so particles registering at higher LETs are mostly nuclei with *lower* kinetic energies.
The differential flux formula for the three different cross-plot types are:
D1D2 x D3D4: 1.19 x counts / time
D1D2 x D5D6: 3.51 x counts / time
D3D4 x D5D6: 0.78 x counts / time
If time is in seconds, the units will be: particles/[cm2 sr sec (KeV/micron)]
This is derived from the following equations and variables:
A) The LET binsize in the plots is ~0.5 KeV/micron.
B) The geometric factors are: [in units of (sr cm^2)]:
1.679 for D1D2 x D3D4
0.569 for D1D2 x D5D6
2.564 for D3D4 x D5D6
C) Assuming a total data collection time of T seconds
Differential flux = particle_count / (geometric factor x energy_bin_size x T)
OR
Diff flux = 2 x counts / [geometric_factor(from table) x T(in seconds)] particles/[cm2 sr sec (KeV/micron)]
D) The time T in exposure seconds is provided both in the txt data file as well as in the title of each plot. In the comment section of each txt file header, there is a new variable called exposureSecs in the following format:
# exposureSecs 289800
Data gaps
2009176
2010041 – Feb. 10 (no geom. files)
2010042 – Feb. 11 (no files)
2010043 – Feb. 12 (no sci. files)
2010044 – Feb. 13 (no sci. files)
2010045 – Feb. 14 (no sci. files)
2010231
2010232
2010233
2011054 – Feb. 23 (geom. 0s)
2011055 – Feb. 24 (no sci. files)
2011166 – June 15 (no sci. files)
2011167 – June 16 (no sci. files)
2012174, 2012182, 2012248 (IDL processing issues)